


Technical decision-making is one of the foundations for increasing productivity on the farm. Each field has its own conditions, and investment in inputs delivers more consistent results when it starts with a reliable diagnosis. That is why soil analysis interpretation is an important step in fertility management.
This interpretation helps identify chemical limitations that can affect root development and crop performance. According to Embrapa’s Manual de métodos de análise de solo [Manual of Soil Analysis Methods], standardised procedures are essential to ensure consistent readings of indicators such as pH and base saturation (V%).
With Stara precision farming technologies, soil analysis data can be used to guide prescription maps, variable-rate application and monitoring machine operation. In this article, you will learn how a soil analysis report is prepared, how to interpret the main indicators and why this step can influence the success of your harvest.
What is soil analysis and how does it generate the report?
Soil analysis is mainly used to assess the chemical condition of the soil and, in complementary analyses, the physical and biological aspects of the cultivated area.
It starts with samples collected from representative points on the farm, taking into account fields, management history, the crop being grown and variability within the area.
After collection, the samples are sent to a laboratory, where they are analysed using standardised methods. The result is presented in a soil analysis report: a technical document showing indicators such as pH, base saturation, aluminium, CEC, phosphorus, potassium, calcium, magnesium, organic matter and texture.
What is soil analysis interpretation?
Soil analysis interpretation turns the figures in the report into management strategies: it helps define what to do, where to apply inputs and how much to invest.
Without proper interpretation, the farmer may apply inputs in a generic way, invest where there is less need or fail to correct issues that are limiting crop performance. When interpretation is carried out carefully, the data helps set clearer priorities, such as:
- correction: adjusting acidity and base saturation, mainly through liming, as well as using agricultural gypsum to improve the rooting environment at depth;
- build-up: increasing nutrient levels in areas with low fertility;
- maintenance: replacing what the crop removes to preserve the balance of the area over successive cycles.
How do you interpret the main soil fertility indicators?
Interpretation can be supported by reference documents, such as Embrapa’s soil analysis interpretation table. Even so, the final recommendation needs to consider the crop, soil texture, field history and analysis method used.
The indicators below have the greatest influence on fertility management.
Soil pH and acidity
pH shows the acidity level of the area and is usually one of the first points assessed in the report. According to Embrapa, pH values between 4 and 5 indicate the presence of exchangeable aluminium. When pH is around 5.2 to 5.3, however, this aluminium becomes almost completely insoluble and tends to cause less damage to the roots.
For this reason, pH helps show whether acidity is limiting the crop and whether correction should become a priority in the management plan.
Base saturation (V%) and aluminium saturation (m%)
Base saturation and aluminium saturation indicate whether the soil’s chemical environment is favourable to root growth. In many agronomic recommendations, soils with V% below 50% indicate that correction is needed, while higher levels generally point to better chemical conditions for most crops.
For crops such as maize, this balance requires even closer attention. In addition to V%, aluminium saturation (m%) close to 15% is often used as a critical limit when calculating lime requirements, helping reduce the risk of root toxicity and support crop development.
Soil CEC
CEC, or Cation Exchange Capacity, indicates the soil’s ability to retain and supply nutrients over time. This has a direct influence on fertility interpretation.
As a practical reference, soils with CEC below 8 cmolc/dm³ usually require closer management because they tend to retain fewer nutrients. Soils with CEC of 8 cmolc/dm³ or above generally have greater nutrient retention capacity.
CEC should always be interpreted together with soil texture and organic matter levels.
Phosphorus, potassium, calcium and magnesium
These nutrients are among the most important in fertility management. Phosphorus requires particular attention because its interpretation depends on soil texture and the method used. Potassium is involved in key processes related to crop development and efficient water use.
In Embrapa’s interpretation table, potassium saturation in CEC is classified as low below 3%, medium between 3% and 5%, and high above 5%. For magnesium, values below 0.4 cmolc/dm³ are classified as low. Together with calcium, magnesium also helps show the chemical balance of the field and whether management should prioritise correction, fertility build-up or maintenance.
Organic matter and texture
Organic matter influences nutrient dynamics, water retention and soil quality over time. Texture helps explain how the soil retains and supplies nutrients.
As a practical reference, Embrapa’s table classifies organic matter as low below 15 g/dm³, medium between 15 and 25 g/dm³, and high above 25 g/dm³. Even so, this information becomes more useful when read alongside texture. The same result can mean different things depending on whether the soil is sandier or more clayey.
Why should report data be interpreted in the context of the field?
Soil analysis provides important indicators, but no result should be read in isolation. For the interpretation to lead to more accurate decisions, the farmer needs to compare the report with factors that explain the reality of each field, such as:
- crop in the field: maize, soybean, wheat and other crops have different nutritional requirements. For this reason, fields with similar report results may require different correction and fertilisation priorities;
- soil type: sandier and more clayey soils behave differently in terms of water retention, nutrient availability, organic matter and response to fertilisation;
- field history: previous fertiliser applications, earlier corrections, yields from recent harvests, compaction, presence of crop residue and crop development patterns help explain the report results;
- variability between fields: within the same farm, areas with different textures, yields and histories may require specific strategies. In one field, the priority may be correcting acidity. In another, building fertility.
What should be done after interpreting soil analysis?
After reviewing the report, the farmer needs to define which fields require correction, fertility build-up or fertility maintenance. This prioritisation helps reduce generic applications and direct inputs to the areas with the greatest need.
Fertility management can be organised into three main approaches:
|
Strategy |
Purpose |
When should each approach be used? |
|
Correction |
Eliminate acidity and toxic aluminium to “open the way” for the roots. |
Correction is used when pH is low and V% is insufficient. |
|
Build-up |
Increase nutrient reserves, such as P and K, to ideal levels. |
Build-up is used when nutrient levels are below the recommended range for the crop. |
|
Maintenance |
Replace exactly what the crop takes up and removes at harvest. |
Maintenance is used when the soil is already fertile and chemically balanced. |
Once the strategy has been defined, the management plan needs to follow a clear sequence before it reaches the field. It starts with the correction of limiting factors, such as acidity and toxic aluminium, which reduce the efficiency of later fertilisation.
After this interpretation, the technical recommendation can be converted into prescription maps. These files organise application rates according to field variability and help the operator apply inputs according to the needs of each area.
How does soil analysis guide the choice of agricultural machine?
After interpreting the soil analysis, the farmer can identify which nutrients need to be corrected, built up or maintained in each field. This helps define the type of fertiliser, the recommended rate and the most suitable application method for the farm.
The choice of agricultural machine is part of this process because each recommendation may require a different application strategy. The type of product, the need for fixed-rate or variable-rate application, the application window, field conditions and expected output all influence the choice between trailed spreaders, self-propelled spreaders, implements or agricultural machines with multiple functions.
Hércules line: spreaders for output and precision
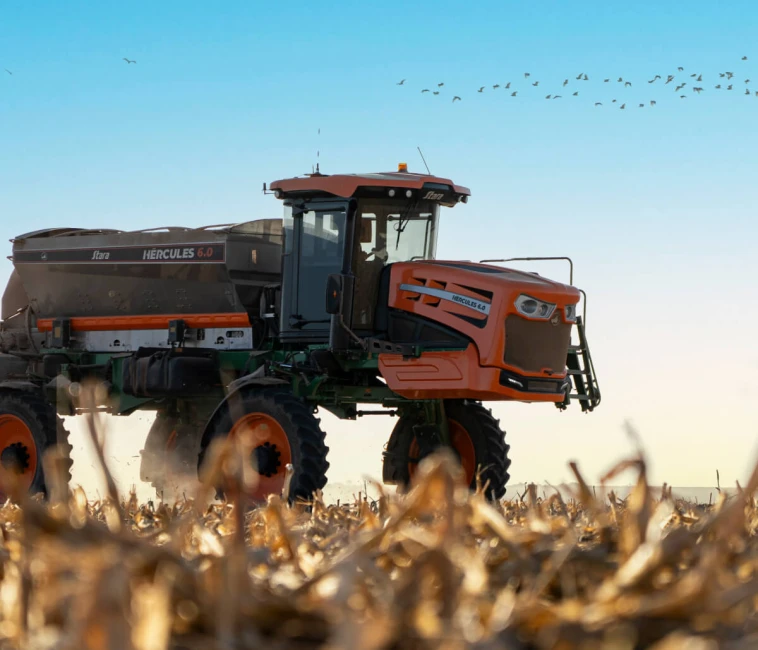
The Hércules line brings together spreaders designed to apply fertilisers, soil amendments and seeds with high distribution quality, operational capacity and precision in the field. Among the self-propelled models, the line includes Hércules 4.0, Hércules 6.0 and Hércules 9.0, meeting different needs for autonomy and output.
Hércules 4.0, for example, has a stainless-steel hopper with capacity of 4,000 kg or 4 m³, active pneumatic suspension and an application width of up to 36 m, depending on the product and application speed. Hércules 9.0 increases operational autonomy with a 9,000 kg or 9 m³ stainless-steel hopper, as well as spinner discs with adjustable vanes and an application width of up to 36 m.
The line also includes trailed spreaders, such as Hércules 10000, 15000 and 24000 Inox, designed for spreading soil amendments, fertilisers and seeds. These models feature stainless-steel hoppers and a dual feedgate system. They are coupled to a tractor and expand Stara’s options for different application needs on the farm.
With features such as vane adjustment, electronic weighing system, Topper, telemetry and connectivity technologies, depending on the model, Hércules line spreaders help the operator adjust application according to the product, the agronomic recommendation and the field conditions. As a result, recommendations generated from soil analysis can be applied with better rate control and greater application uniformity.
Bruttus and Twister lines: options for different application methods
Bruttus line is a suitable option when soil analysis shows the need to apply soil amendments and granulated fertilisers uniformly, with less interference from wind. Its gravity distribution system places the product more directly in the field, helping the operator follow the agronomic recommendation with greater consistency, especially when the priority is to reduce variation during application.
Twister 1500 hydraulic spreader is designed for applying fertilisers and fine seeds in different management strategies. Depending on the machine configuration, it can operate at a fixed or variable rate, allowing the application to be adjusted according to the recommendation defined after the soil analysis has been interpreted.
Imperador 3.0: versatile fertiliser application
Imperador 3.0 is a suitable option when soil analysis interpretation points to management practices that require different application methods at different stages of the crop cycle. The machine combines a sprayer with central booms, a spreader and a pneumatic seeder, allowing different production stages to be carried out while keeping the same tramline in the field.
For fertiliser distribution, Imperador 3.0 has a dedicated hopper for fertilisers and seeds, as well as a dual feedgate system with a divider. This allows one side of the hopper to be closed to avoid spreading product over areas that have already been covered.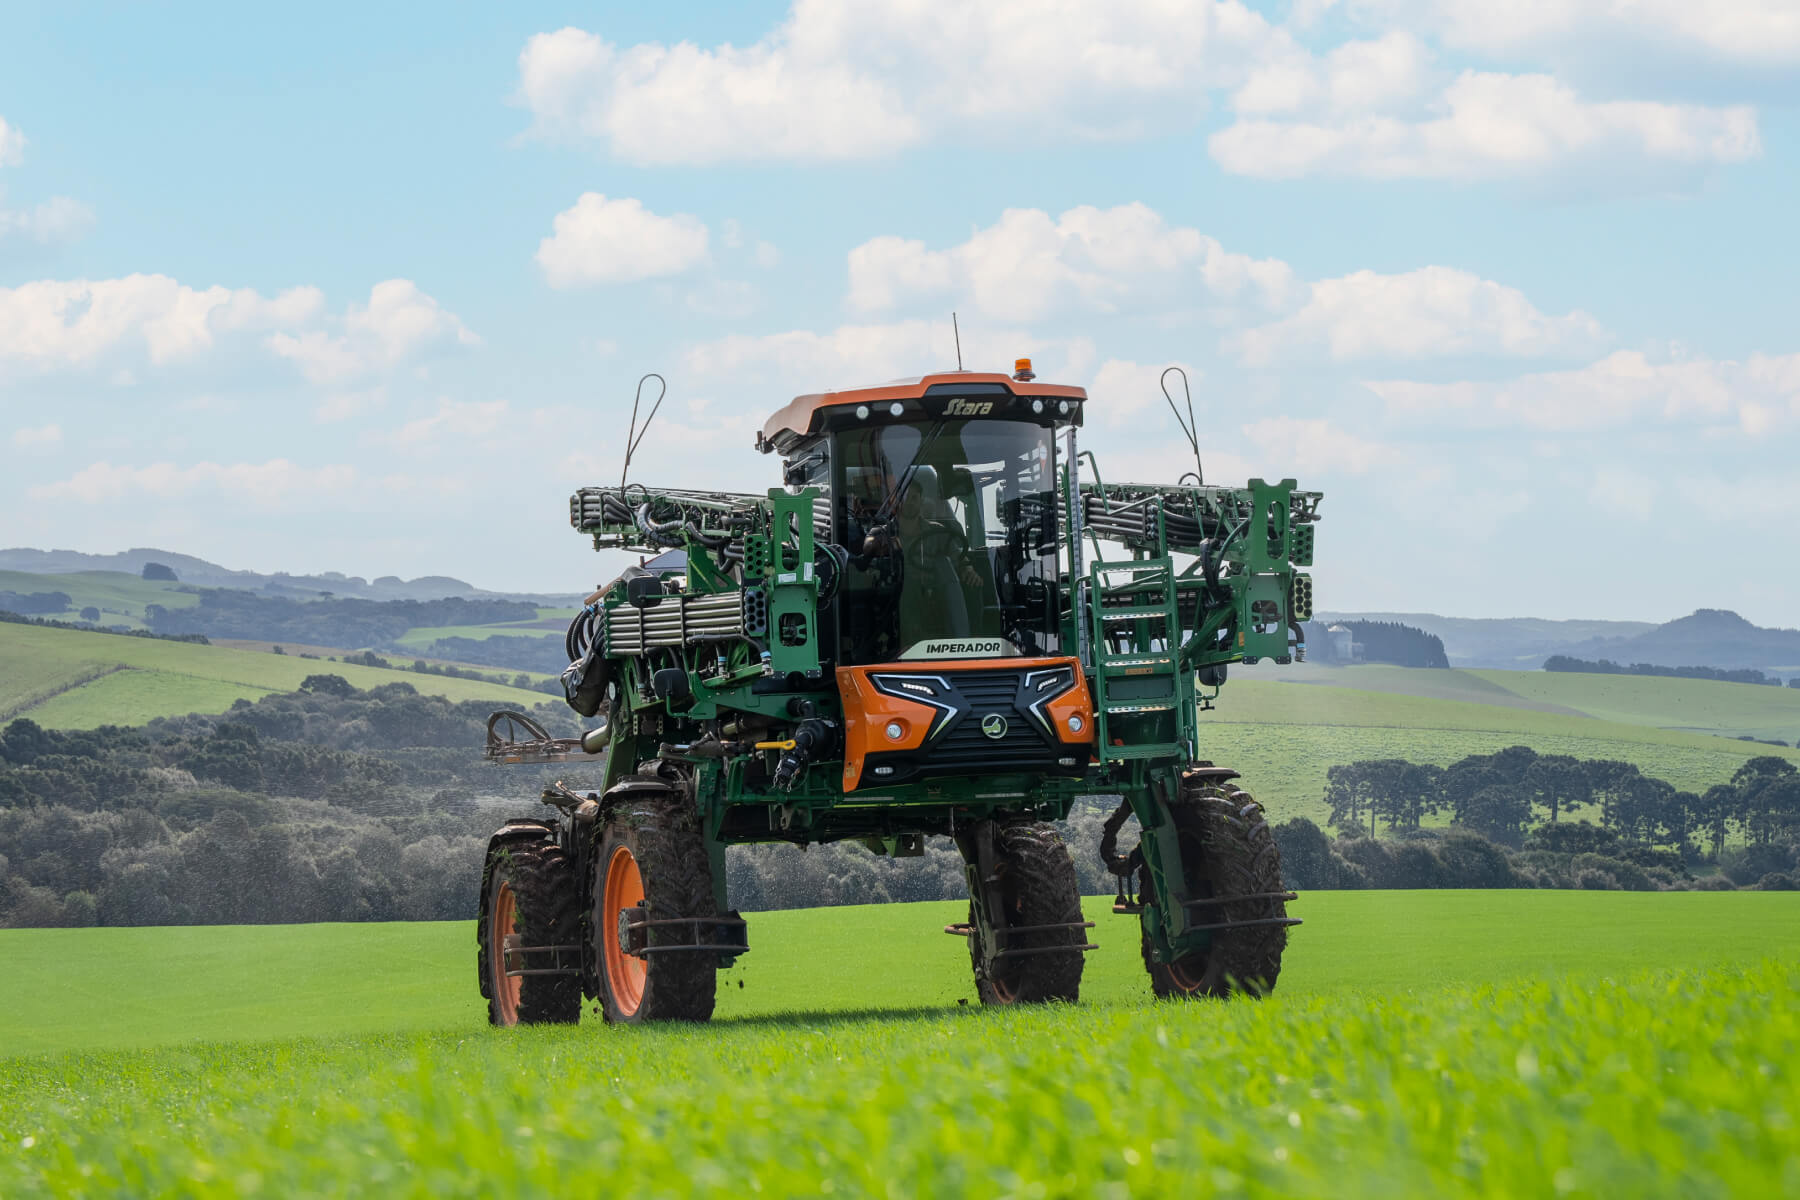
How does Stara technology connect soil analysis with precise application?
After soil analysis has helped define the product, application rate and most suitable agricultural machine, the next step is to ensure that the recommendation is applied accurately in the field. This is where Stara technologies connect agronomic planning with field application.
With Stara Telemetry, prescription maps can be sent directly to the Topper controller, without manual transfer by USB flash drive. In the field, Topper reads the prescription and guides the machine during variable-rate application, adjusting the rate according to its position in the field.
This helps the operator follow the recommendation defined for each management zone, reducing blanket applications and improving consistency between diagnosis, planning and execution. This allows areas with different needs to receive adjusted rates according to the soil analysis results.
Stara Machine Monitoring closes the loop by tracking the machine in real time. When a monitored parameter is outside the limits set on Topper, an alert appears on the Topper screen, helping the operator maintain greater control during application.
Soil analysis interpretation for prioritising field decisions
In this article, you have seen how interpreting soil analysis helps turn the report into practical management decisions. Reading pH, base saturation, aluminium, CEC, nutrients, organic matter and texture together shows whether the field’s priority is correction, fertility build-up or maintenance.
It is also clear that no indicator should be assessed in isolation. Crop, soil type, field history and variability between fields all influence how results should be interpreted and help the farmer target investment in inputs more effectively.
When this interpretation is combined with precision farming, the data from the report can guide prescription maps, application rates and field monitoring. With Stara machines and technologies, farmers can connect diagnosis, planning and execution more effectively, making more informed decisions at every stage of management.
Frequently asked questions about soil analysis interpretation
How do you interpret a soil analysis correctly?
The report should be read as a whole. pH, base saturation, aluminium, CEC, nutrients, organic matter and texture all complement one another. Interpretation becomes more accurate when it also takes the crop, soil type, field history and variability between fields into account.
What is Embrapa’s soil analysis interpretation table?
Embrapa’s soil analysis interpretation table is a technical reference used to classify report results into ranges such as low, medium and high. It helps organise the interpretation of certain indicators and provides clearer guidance for management, but it should be used alongside an assessment of the crop, soil texture and field conditions.
Is Embrapa’s soil analysis interpretation table enough to define management?
No. The table helps guide interpretation, but recommendations should not be taken from it automatically. Management also needs to consider production history, variability between fields, soil type and the crop’s purpose. This broader view makes the interpretation more useful for decision-making.
How does precision farming help with fertility management?
Precision farming helps turn interpretation into more targeted field application. It allows farmers to use report data to guide decisions by field or management zone, supporting more careful use of inputs and greater consistency between diagnosis and application.
What are the most common mistakes in soil analysis interpretation?
The most common mistakes include reading indicators in isolation, treating tables as ready-made answers, ignoring texture and organic matter, repeating the same recommendation across all fields and separating interpretation from practical management. These issues reduce the practical value of the report.
Did you find these guidelines useful and want to find the right agricultural machine for your field?
Visit a Stara dealer and discover the agricultural machines and technologies that help farmers turn soil diagnosis into more profitable field application.